Quantifying the Swiss marriage tax
This Sunday – incidentally on International Women’s Day – Swiss citizens will vote on an initiative about taxes for married couples: if it passes, married couples with tax residence in Switzerland will file taxes individually rather than jointly. The rationale behind this proposal is that married couples currently pay a different level of tax than if they weren’t married, due to how the tax formulas are set up. The current situation is sometimes referred to as “marriage tax”, because many couples pay more tax when they are married. And indeed, I know couples who choose not to marry because of this.
However, is it true that married couples pay more tax? To which extent? In this post, we’ll do some data analysis of the tax formulas to investigate when couples pay more (or less taxes), and how much the difference is.
For simplicity, I’ll focus on income tax only, at the federal and cantonal level, and on couples who don’t have children or dependents. An exhaustive analysis is well beyond the scope of this blog post, as there are many local rules in the various regions of Switzerland, but I hope it gives some general insights about the current situation.
In the appendix, I’ll present more details about my code, which is also open source.
Information provided in this post isn’t legal nor financial advice. It is merely my personal understanding, without any guarantee of correctness.
Overview of the Swiss tax system
The three levels of tax
Switzerland is a federal country, divided into 26 cantons. For tax purposes, there are 3 relevant administrative levels: federal, cantonal and municipal. Each person or couple pays income and/or wealth tax for each of these levels. Cantons have a lot of freedom in setting tax laws for their residents, and as we’ll see later some have defined very creative formulas to calculate taxes.
The general procedure to file income taxes is to enter all income on one side, and list applicable deductions on the other side. The difference between the two gives the taxable income. Because each canton is free to define its own deductions, there are in fact two taxable incomes: one at the federal level and one at the cantonal level. Then, one applies the tax formulas of the confederation and the canton in question to obtain the federal tax and the base cantonal tax.
Within each canton, each municipality is also free to set its own tax level, generally by applying a multiplier to this base cantonal tax (i.e. municipalities don’t set their own formulas). With 26 cantons there might of course be exceptions I’m not aware of, but that’s the general idea. Cantons may also apply a multiplier to the base tax, which allows yearly adjustments without changing the base formula, nor affecting the finances of the municipalities. For example, the canton of Zurich recently decreased its multiplier from 98% to 95%.
At the end, personal income tax generally looks as follows:
where is the federal tax, is the base cantonal tax, is the cantonal multiplier and is the municipal multiplier.
In most cantons, there is also a Church tax for individuals affiliated with some religions. This is another multiplier on the base cantonal tax, but much lower than the baseline so for simplicity I’m skipping it for the rest of this post.
Income tax progression
The next relevant part is the formula to go from the taxable income to the federal tax and base cantonal tax . At the federal level and in most cantons, the tax follows a piecewise linear function of the taxable income. This means that the taxable income is divided into brackets, and a fixed percentage – the bracket’s marginal tax rate – is applied to the portion of income that falls into each bracket.
For example, here are the federal income tax rates for a single person in 2025.
| Starting income (CHF) | Base tax (CHF) | Marginal rate |
|---|---|---|
| 0 | 0 | 0% |
| 15,200 | 0 | 0.77% |
| 33,200 | 139 | 0.88% |
| 43,500 | 229 | 2.64% |
| 58,000 | 612 | 2.97% |
| 76,100 | 1,150 | 5.94% |
| 82,000 | 1,500 | 6.6% |
| 108,800 | 3,269 | 8.8% |
| 141,500 | 6,146 | 11% |
| 184,900 | 10,920 | 13.2% |
| 793,400 | 91,241 | 11.5% |
However, I learned during this analysis that there are exceptions to this pattern.
- In the canton of Fribourg, it’s the average tax rate that follows a piecewise linear progression.
- In Obwald and Uri, income tax is a fixed percentage that doesn’t depend on the income (flat tax).
- In Basel-Landschaft, income tax follows an elaborate mathematical formula: here was the 2025 formula.
The following plot shows the income tax rates at the federal level and in some selected cantons, which reveals a wide range of tax policies. Behind the tax haven reputation of Switzerland hides a lot of disparity.

The tax brackets are generally adjusted every few years to follow inflation, or to make intentional political choices. The canton of Valais has a very peculiar methodology: the baseline tax bracket table is fixed for many years, but the input taxable income is “de-indexed” for inflation, following a complicated algorithm1.
Additionally, various rounding rules are possible. Some cantons round the input taxable income down to a multiple of 100 CHF, while others use the raw value. From what I’ve seen, output tax is always rounded to a full amount excluding cents.
Married couples
In the eyes of the tax administration, couples that are not married nor in any form of registered partnership are simply made of two single individuals, who each file their own taxes.
However, as mentioned in the introduction, married couples file their taxes jointly. This means that all the income and deductions of the couple are added together, to obtain the taxable income (as mentioned above, one at the federal level and one at the cantonal level). There are then two approaches to calculate taxes:
- in some cantons, a separate table is defined for married couples with its own tax brackets,
- in others, a so-called splitting factor is applied to scale the couple’s taxable income, and the baseline tax table of individuals is then used on this reduced income.
How does a splitting factor work? If we call the base cantonal tax of a couple, a splitting factor of means that a couple earning an income should have the same tax rate as a single person earning . In other words:
This equation simplifies to:
For example, with a splitting factor of , then a couple where both partners earn the same income will owe a joint tax of , which means that this couple would pay exactly the same tax if they are married or not. This is however making many assumptions: that all the deductions are the same whether married or not, that both spouses have an equal income, and that the splitting factor is . In practice, the splitting factor is usually or a bit lower.
Let’s look at some examples. In the canton of Fribourg, a splitting factor of 2 applies in 2025, and indeed a single person with a taxable income of 100,000 CHF per year pays the same cantonal tax rate (10%) as a married couple with total taxable income of 200,000 CHF per year.

At the federal level however, a completely separate table is defined for married couples. A single person with a taxable income of 100,000 CHF pays a federal tax rate of around 3%, while a married couple with 200,000 CHF of income pays a federal tax rate of 6%.

Whatever the rules are, we can express the “marriage penalty” of a couple whose respective taxable incomes are and as the difference between their income tax for the total income and the taxes they would pay as two independent individuals:
The rest of this post will focus on creating plots of this difference as a function of and , for the federal income tax and the base tax of each canton.
This is certainly a simplification. Notably, tax tables are different for people who have dependent children. The purpose here is to look at general trends under simple assumptions, but making a comprehensive comparison tool is beyond the scope of this blog post.
Methodology
Obtaining tax rate data
In theory, my plan was simple: find open data about the tax formulas, then create a 2-dimensional color plot of the difference. In practice, my first hurdle was to obtain machine-readable data. Indeed, taxes are defined in laws, which are usually distributed as natural language text (in one of the Swiss national languages), each canton using its own formatting and distribution method (HTML page or PDF). Some publish huge PDF tables with pre-calculated values by increments of 100 or 1000 CHF, rather than a simple formula summarizing the dozen brackets or so.
Thankfully, after asking around, someone pointed me to the online tax calculator of the Federal Tax Administration. It’s available in three national languages plus English, and provides both a tax calculator for your personal situation as well as statistics and crucially, the raw data about tax formulas. This is an extensive data source, that covers many aspects of the tax code in all cantons and municipalities, currently for all tax years from 2010 to 2025.
Unfortunately, the web UI is inconvenient: it only allows you to display tables filtered by year and location, but these don’t use standard HTML table elements (you can’t select text nor copy-paste it).
There’s also an export button (for a given filtered table), but this creates a .xlsx spreadsheet, which is again inconvenient to work with.
However, this web interface uses a JSON API under the hood, with support for bulk queries.
So I made a first tool to automate downloading this data.
It’s unfortunate that such data isn’t more easily accessible under a clear open data license, for example on the Swiss open data portal. Citizens and residents (and everyone really) should have a right to know and distribute information about tax rules, even more so when they are directly voting on changes to the tax rules!
Validation
While the raw data contains a lot of information (see my inferred data schema) with all the tax brackets and cantonal/municipal multipliers, it was still important to validate that calculations were roughly correct. My strategy was to write algorithms to compute the expected tax from a given income, and compare the results on some examples with the online tax calculator API.
Once again, this is only a soft guarantee of correctness. There are many things that could go wrong: tests on some examples are by nature non-exhaustive, there might be errors in the data provided by the online calculator I used, etc. I’m neither an accountant nor lawyer, so please consult a dedicated professional if you need financial or legal advice.
Nonetheless, this approach allowed to infer more precise rules.
- There are a few ways to round (or not) the income to a multiple of 100 CHF, and these tests allowed to infer which canton is doing what.
- In the canton of Vaud, a special general tax reduction of 3.5% is applied to the result since 2024, but this rule wasn’t part of the tax tables nor included in the cantonal multiplier.
- Similarly, in the canton of Geneva there is a general tax reduction of 12% plus an additional tax of 1% (details), which are again not included in the cantonal multiplier.
One case I left aside was the canton of Valais. While it is clear that there are specific rules to de-index the income for inflation, I didn’t find the corresponding indexation factors in the data. Even by finding some values on the cantonal website, I didn’t manage to reproduce identical results. Therefore I’ve left Valais out of the scope of this post: better no data than incorrect data.
Results
Once I was confident that I reproduced the tax calculations accurately enough, I could move on to plotting the results. It’s now time to finally answer the question: what kind of couples are affected by the marriage tax penalty, and who on the contrary benefits from being married?
To give more context about the numbers, the median yearly income of employed people was 84,288 CHF in 2024, with a 10th percentile of 55,620 CHF and a 90th percentile of 150,312 CHF, according to the Federal Statistical Office.
If we look at the federal tax alone, there is a clear disadvantage to being married as long as both partners earn more than about 20,000 CHF per year (after deductions). In absolute numbers, the additional tax reaches up to 12,000 CHF per year.
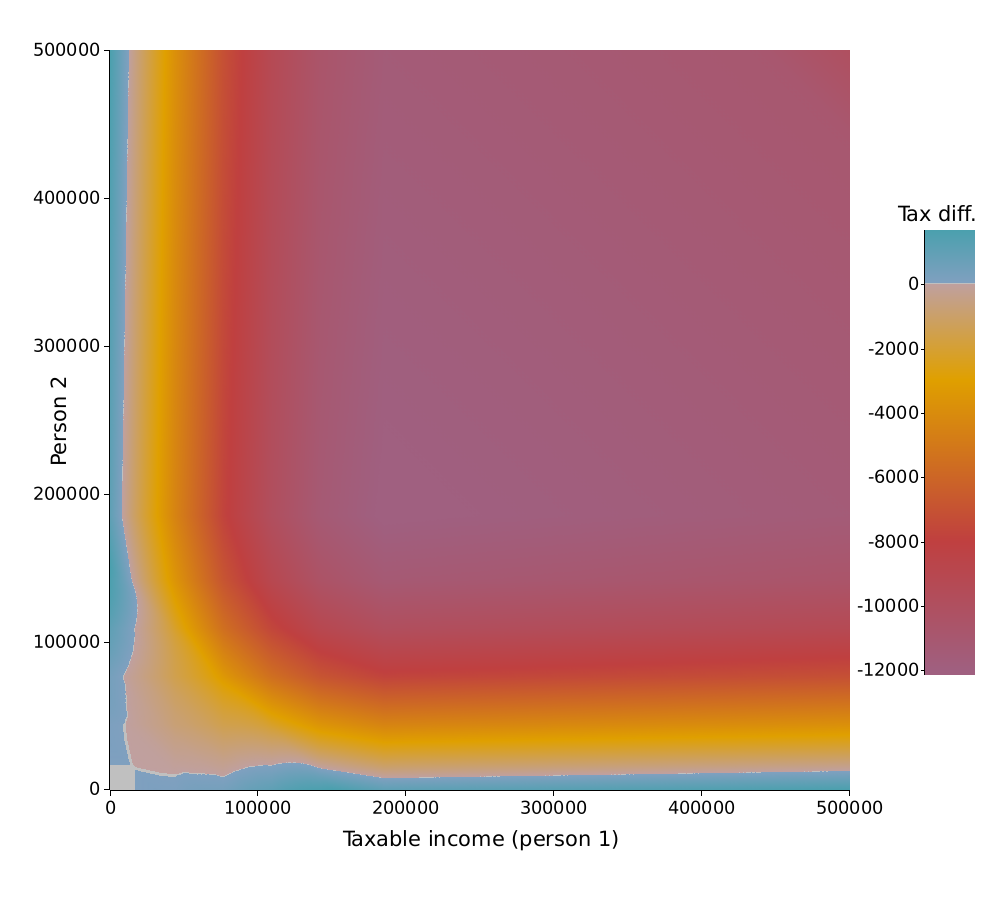 Marriage tax difference at the federal level in 2025.
A negative difference means that a married couple pays more tax.
If we look at this difference as a percentage of the total income, we see that it can exceed 3.5%, when both incomes are between 100,000 and 200,000 CHF.
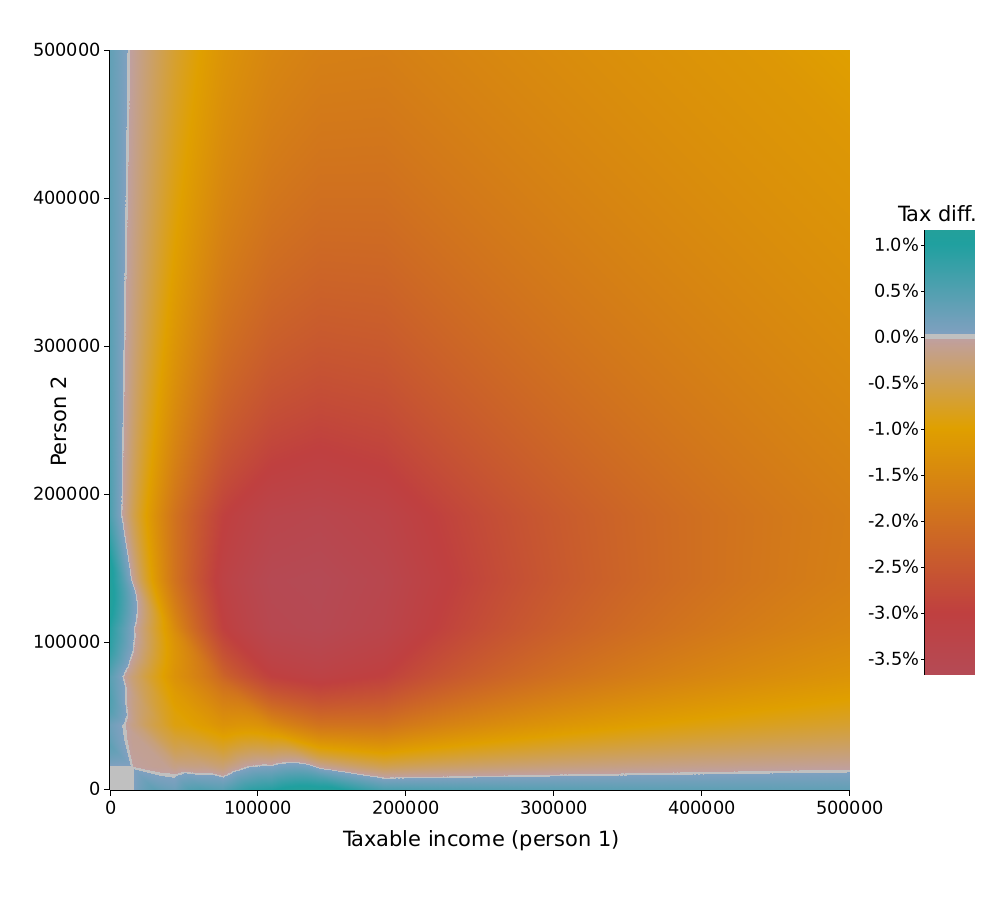 Marriage tax difference as a percentage of total income at the federal level in 2025.
A negative difference means that a married couple pays more tax.
A similar situation happens in the cantons of Zurich and Ticino, but the magnitude is lower as the marriage penalty for cantonal tax is at most around 1% of total income. Couples where only one person earns an income may even pay 3% less cantonal tax.
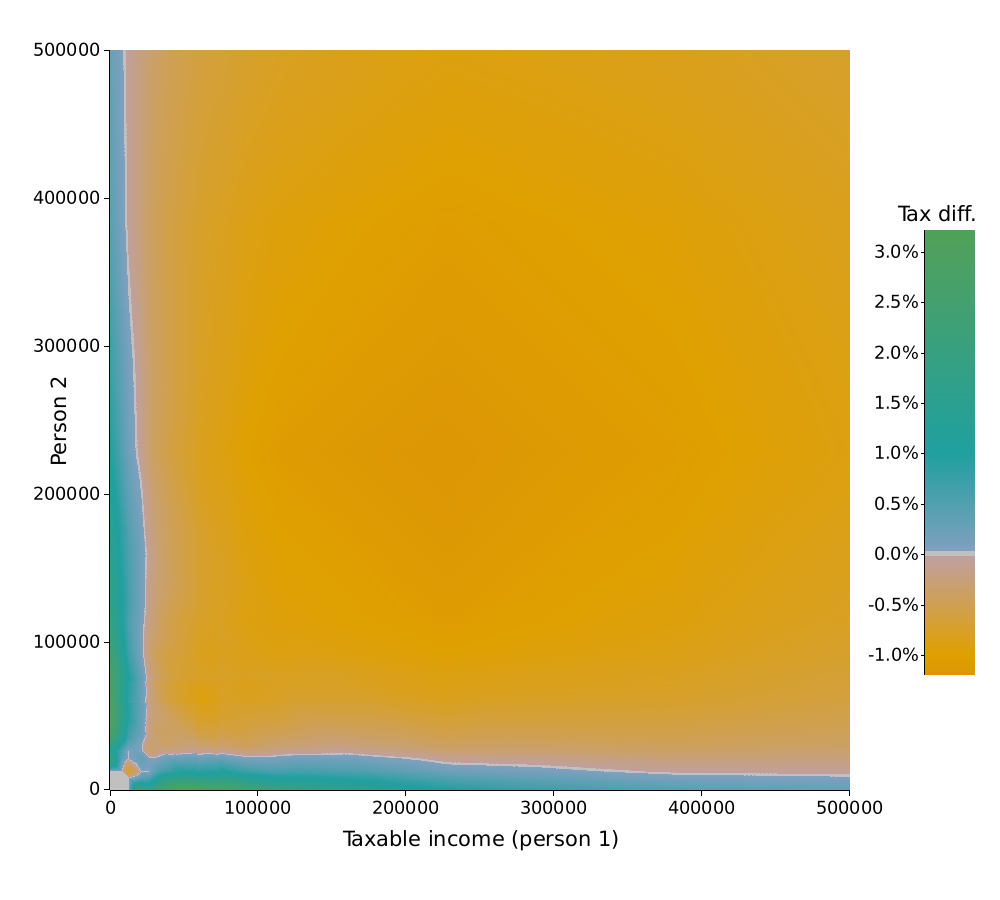 Marriage tax difference as a percentage of total income in the canton of Ticino in 2025.
A negative difference means that a married couple pays more tax.
However, things are more contrasted in other cantons.
Let’s first look at Fribourg, which as mentioned above applies a splitting factor of 2. This means that couples who earn an equal income (along the diagonal) pay the same tax whether married or not, which is confirmed by the graph. However, married couples with moderate income inequality pay less tax, but those where one person earns significantly more than the other pay more tax.
There are also some interesting shapes close to the main diagonal, due to how the tax progression function is defined in this canton.
 Marriage tax difference as a percentage of total income in the canton of Fribourg in 2025.
A negative difference means that a married couple pays more tax.
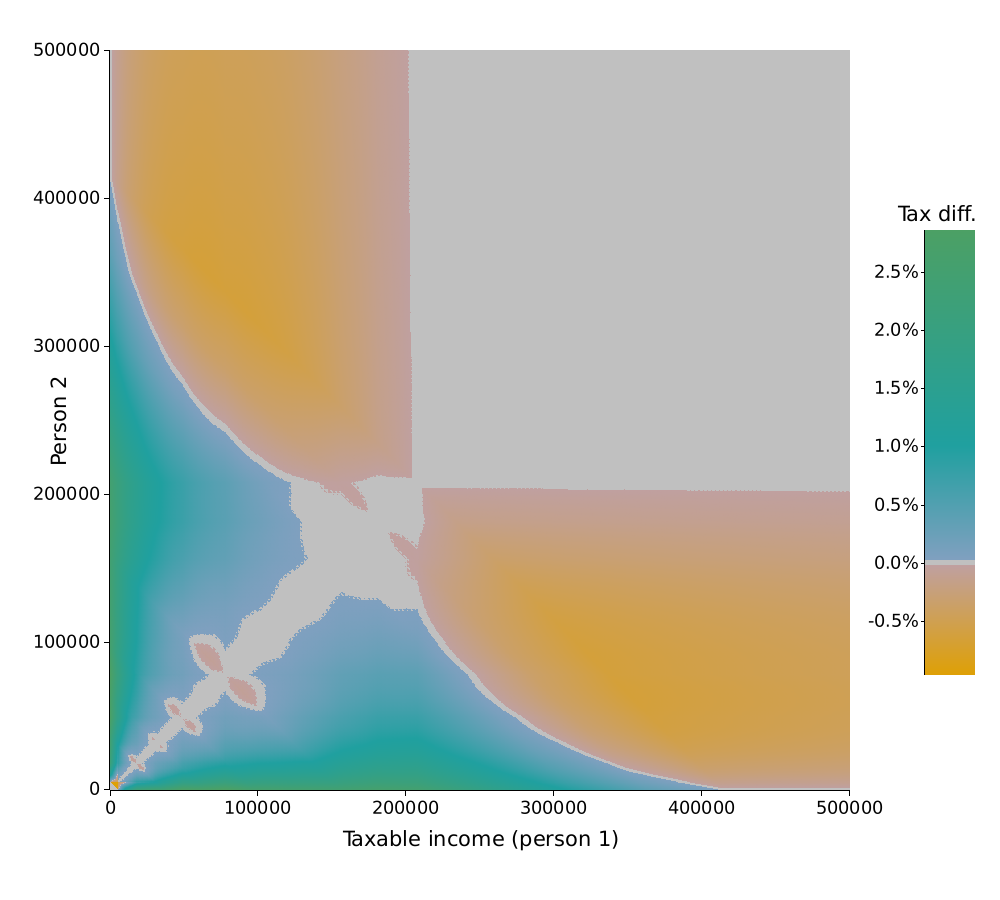
Another interesting – or shall I say artistic – result is in the canton of Neuchatel, which applies a splitting factor slightly below 2. There, the marriage differential has a bird-like shape:
- Partners with similar income pay a slight additional cantonal tax (main diagonal from the lower-left to the top-right).
- Partners with vastly inequal incomes pay a substantial additional cantonal tax (wings of the bird in the top-left and lower-right corners).
- However partners with somewhat inequal incomes pay less cantonal tax when married (blue and green areas around the bird).
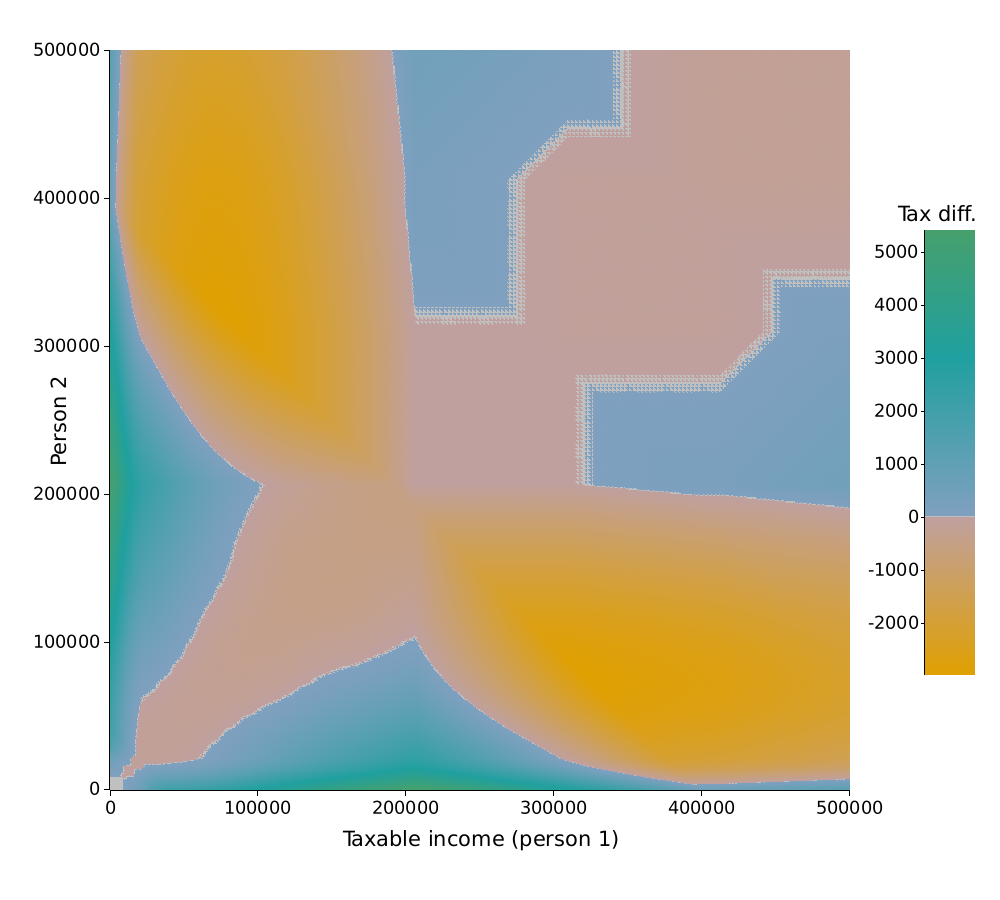 Marriage tax difference in the canton of Neuchatel in 2025.
A negative difference means that a married couple pays more tax.
Let’s finish this overview with the canton of Geneva: there the cantonal tax is always lower for married couples, with a bonus that can exceed 12,000 CHF per year. Except along the main diagonal where marriage has a neutral effect – the shape of this neutral zone is an interesting alignment of squares.
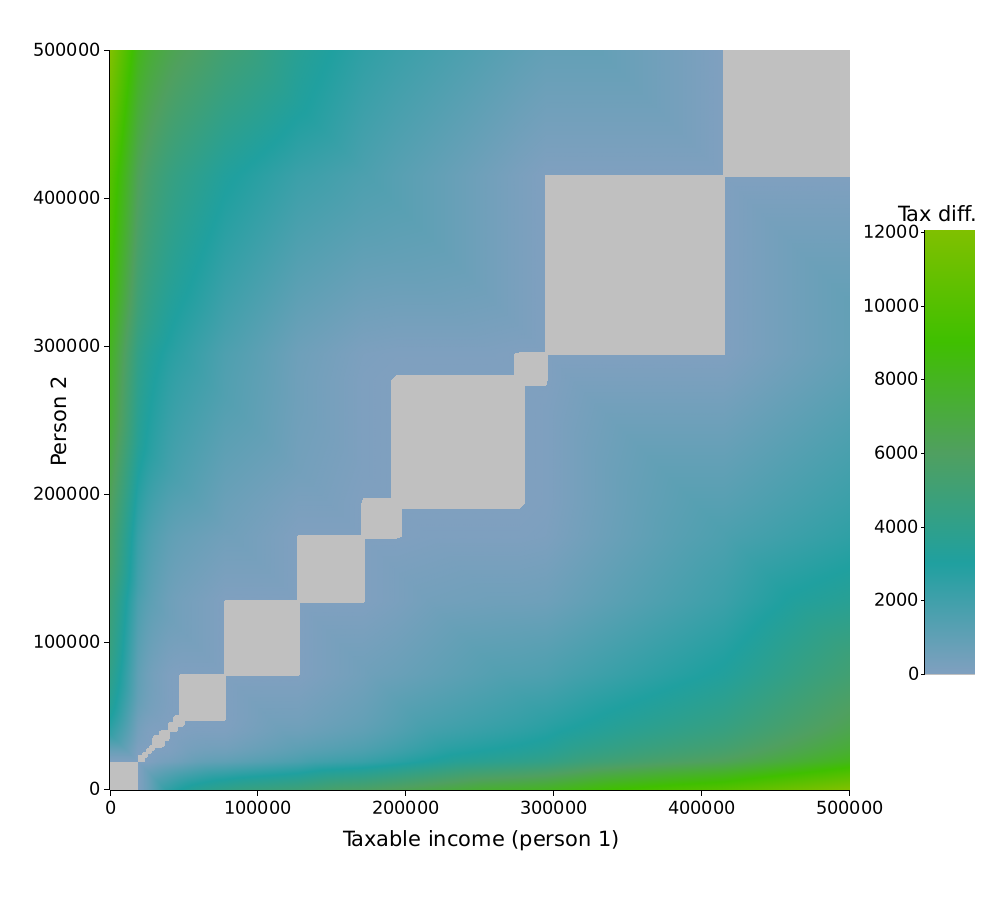 Marriage tax difference in the canton of Geneva in 2025.
A negative difference means that a married couple pays more tax.
At this point, the conclusion is that it really depends. Each of the 26 cantons has its own tax rules, which leads to a diverse set of outcomes. You can use the interactive visualization just below to explore more scenarios.
Remember though: the total tax is the sum of the federal, cantonal and municipal taxes. Therefore marriage penalties or advantages may add up or cancel each other depending on each specific situation. Besides, I’ve not considered children, wealth tax nor the effect of tax deductions in this analysis, and these factors may play a role too.
Interactive visualization
Appendix: behind the scenes
Here is a brief description of the technologies I’ve used to create these graphs. You can find my code on GitHub.
If you’ve read my blog before, you may know that I’m a very keen user of the Rust programming language.
Notably, importing JSON data and converting it into typed structured data was a breeze with libraries like reqwest and serde, as I’ve explained in my previous post.
// Excerpt from the JSON schema to import a tax table.
#[derive(Clone, Debug, Deserialize)]
#[serde(deny_unknown_fields, rename_all = "PascalCase")]
pub struct Scale {
    pub location: Location,
    #[serde(deserialize_with = "comma_separated")]
    pub group: Vec<Group>,
    // Splitting factor for married couples.
    pub splitting: f64,
    pub table_type: TableType,
    pub target: Target,
    pub tax_type: TaxType,
    // List of tax brackets in the table.
    pub table: Vec<ScaleEntry>,
}

#[derive(Clone, Debug, Deserialize)]
#[serde(deny_unknown_fields, rename_all = "PascalCase")]
pub struct ScaleEntry {
    // Arithmetic formula (for Basel-Landschaft only).
    pub formula: String,
    // Base tax of this bracket.
    pub taxes: f64,
    // Tax rate in percent.
    pub percent: f64,
    // Starting income of this bracket.
    pub amount: f64,
}
This worked really well for the majority of cases, where the tax rules are split into a table of tax brackets, with a marginal (or occasionally average) tax rate per bracket.
As discussed above, the canton of Basel-Landschaft uses elaborate mathematical formulas, which required a dedicated parsing library.
I’ve used nom which provides an excellent API to build your own parsers.
In particular, it had an example about parsing arithmetic, which was straightforward to adapt to my use case.
For presenting the results, I’ve chosen plotters, a simple yet effective drawing library.
In particular, it can be compiled to WebAssembly (a.k.a. WASM), which is what I’ve used for the interactive visualization.
Speaking of WASM, this was my first time using it, and I must say it went smoother than expected.
The wasm-pack tool makes it easy to compile Rust code to WASM and package it with a JavaScript loading module.
By default, this creates an npm package with TypeScript, but we don’t do that here: as my blog is a simple static website, I just needed a raw API over the WASM code.
This turned out to be straightforward with the --no-typescript and --no-pack parameters.
wasm-pack build --target web --release --no-typescript --no-pack
In practice, the entry point for my WASM module on the Rust side is also fairly simple.
The JavaScript that calls it provides a <canvas> element as well as a few parameters to customize the chart, and the compiled Rust code inside the WASM module draws on the canvas.
use wasm_bindgen::JsValue;
use wasm_bindgen::prelude::wasm_bindgen;
use web_sys::HtmlCanvasElement;

#[wasm_bindgen]
pub struct State {
    ...
}

#[wasm_bindgen]
impl State {
    #[expect(clippy::new_without_default)]
    #[wasm_bindgen(constructor)]
    pub fn new() -> Self {
        /* Load the data */
        ...
    }

    pub fn plot(
        &self,
        canvas: HtmlCanvasElement,
        year: u32,
        canton: &str,
        max_salary: i32,
        percent: bool,
    ) -> Result<(), JsValue> {
        /* Draws a chart on the given canvas */
        ...
    }
}
Calling this from HTML/JavaScript is then straightforward: wasm-bindgen takes care of converting values to compatible types between JavaScript and Rust.
<canvas id="my-canvas" width="730" height="600" />
<script type="module">
import init, { State } from 'wasm_taxes.js'

const canvas = document.getElementById("my-canvas");

async function run() {
    await init();
    const state = new State();

    var year = 2025;
    var zone = "CH";
    var max_salary = 150000;
    var percent = false;
    state.plot(canvas, year, zone, max_salary, percent);
}

run();
</script>
The last piece of my setup was how to encode the tax formulas and provide them to the WASM module.
I ended up using serde again to define a schema containing only the relevant data, and used the postcard format to encode it.
Postcard is a simple binary format that is more compact than JSON and much simpler to parse.
And rather than having the JavaScript code download the data and pass it around to WASM, I simply hard-coded the data in the WASM module via the include_bytes! macro.
This saves some network round-trips and should make my website generally faster to load.
use serde::Deserialize;

#[derive(Deserialize)]
pub struct Database {
    ...
}

impl Database {
    pub fn load() -> Result<Self, String> {
        const DATA: &[u8] = include_bytes!("../data/tables.db");
        postcard::from_bytes(DATA).map_err(|e| format!("Failed to parse data: {e:?}"))
    }
}
I’ve also applied some optimizations to make sure the WASM module is reasonably small, so that my website keeps being fast.
Out-of-the-box, using the plotters library to draw on a canvas created a WASM file of around 100 KB, compressing to 40 KB.
This is in the acceptable ballpark, but increased once I embedded the data and made the graph more customizable.
The most relevant optimizations I’ve done were then as follows.
- Using the recently added
panic=immediate-abortoption of Rust. This removed various error handling code paths and error messages. While these errors are useful for debugging, there’s anyway not much JavaScript can do to handle unexpected panics from Rust. - Store the embedded data in sorted form to remove the need to use hash tables. Less logic = less code = smaller WASM binary.
- Leverage interning to deduplicate tables that didn’t change for several years. See my previous blog post, which I’ve since then converted into a library.
At the end, my WASM module weighs 195 KB, compressed to 72 KB.
-
See for example the following description, in French: https://fbk-conseils.ch/impot-cantonaux-en-valais/ ↩
Comments
To react to this blog post please check the Mastodon thread, the Lobste.rs thread and the Reddit thread.
You may also like